How to run experiments to maximize growth
Insights from Formsort's webinar
Conversion funnels are essential to turning visitors into customers for online companies. An optimized funnel can make all the difference when it comes to driving revenue and growing your business. Enhancing your funnel can be a complex process, however, as it's not always obvious what changes will have the biggest impact. This is where experimentation comes into play. By running experiments at different parts of your funnel, you can identify areas for improvement and optimize your conversion rates. Creating a data-driven process of testing and feedback implementation is at the core of understanding consumer behavior and guiding users successfully through the funnel.
In this article, we will discuss the lifecycle of an experiment, from ideation to systematization, and explain best practices for each stage based on insights shared in our recent webinar with panelists Samuel Kim of Mindbloom, a digital health service provider for anxiety and depression, and Karim El Rabiey of Pearmill, a performance marketing agency.
Optimizing conversion rates through experiments
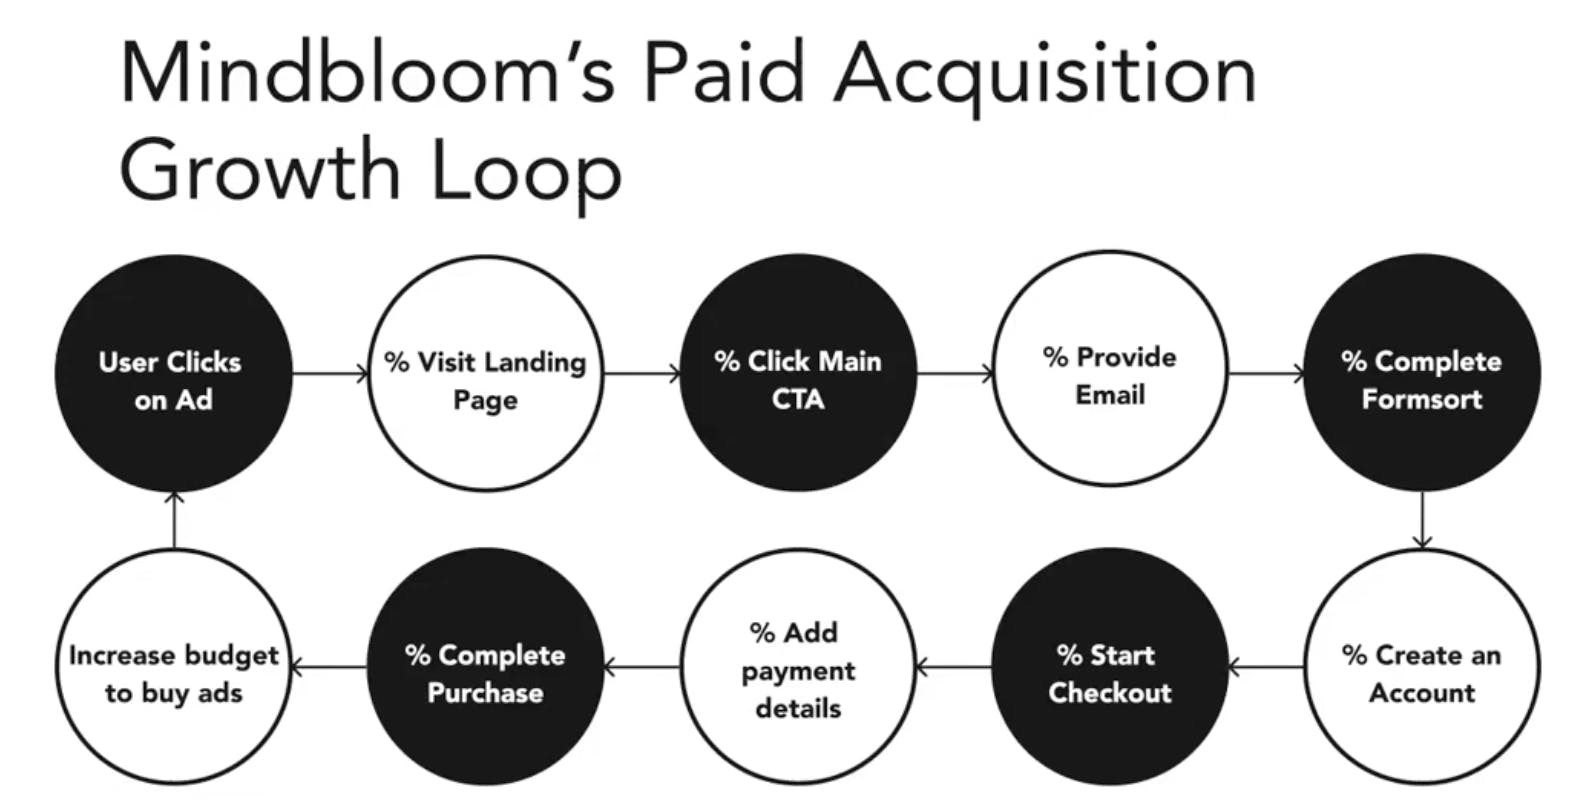
In practice, a strong funnel that works for your specific product or service, company, and customers requires hundreds of big sweeping tests as well as minute fine-tuning experiments. Experiments are valuable in all parts of your marketing funnel–you can think about building awareness and consideration, increasing conversion, or improving your retention numbers. In this article we will focus on examples related to increasing conversion, and specifically Mindbloom’s paid acquisition conversion loop, but the ideas are relevant across the entire marketing funnel.
The Mindbloom growth loop below depicts steps in their paid acquisition funnel, each of which is a potential dropoff point in the customer journey. Their growth team has developed a robust system of experimentation to continuously improve the steps of this funnel. This system has not only improved their conversion rates so far, but has also given them a way to continually learn about their customers’ changing needs and responsively adapt their services.
Build a strong experimenting process to get long-term results
A strong culture of experimentation combines speed and common sense with research and analysis. According to El Rabiey, “The sign of a strong growth and product team is that they've built a machine that continuously generates ideas, executes them, and analyzes them. An individual tactic is great, but spending the time and effort on a process that continuously generates ideas will help you learn more, strengthen your intuition, and grow your customer base.” This is why Mindbloom continuously implements a 5-stage experimentation loop to optimize their paid acquisition conversion rates.
A closer look at the 5 stages
Stage 1: Ideation
Ideation might be the most important stage since it determines the trajectory of the entire experiment process. This is the time to hold a brainstorm session and consider all the possible ideas you might test. Ideas can come from examining problems indicated by your funnel data, customer feedback, and team member observations. For example, where are leads abandoning the onboarding process? What are the reasons potential customers are citing for not purchasing? What issues have been flagged internally?

It is important to have a process in place to take in quantitative and qualitative data and use these to inform your decisions about the experiments you will run. Kim stresses the importance of understanding both the quantitative data such as identifying drop off points in the funnel and qualitative data like talking to customers to learn why they’re dropping off at those points.
You should start by identifying the metrics you want to move in this round of experiments. For example, activation is one possible metric. Activation is the point at which the potential customer reaches a defined level of engagement with the product. They are then seen as extracting enough value to be deemed successful and statistically likely to retain. The Fogg Behavior Model shows that at least 2 elements must converge at the same moment for a behavior change to occur. These two factors determine when the activation point may occur: ability, which refers to how easy it is for them to buy, and motivation, which refers to how much they want to buy. So the two levers you’re pulling to activate are:
- How can I increase the motivation–make it more desirable for someone to purchase or use the product?
- And how can I make it easier for a person to buy and use my product? What obstacles can I remove to help them sign up?
What other metrics do you want to target–do you want to increase the click-through rate (CTR) at the top of your funnel? Or build trust through social proofs to strengthen the middle of your funnel?
Once you decide on the metrics you want your experiments to target, consider the size and the scope of the bet you want to make. A big bet is a months-long, centralized experiment that can be complex in scope, drain resources, and take months before yielding results. In contrast, a small bet is a quick experiment that can be run efficiently with the goal of having minor improvements that compound over time. If you are interested in rapidly testing and improving, it might be easier to have smaller bets that you learn from over the course of a longer period.
At the end of the ideation stage, you should have several proposed ideas to test. If you have millions of people going through the funnel, you can test every idea you have because you are going to get statistically significant results quickly. If your funnel traffic is in the thousands, you'll have to be more selective about the experiment ideas in order to see the impact. The next section will describe how to identify the top ideas to test.
Stage 2: Prediction & Prioritization
Your team’s time and resources are limited. In this critical stage, your team will consider the ideas from the previous stage and prioritize them based on which ones you think will have the biggest impact in improving the targeted metrics. The Mindbloom team uses several factors to create a rubric for prioritization: impact, confidence, and effort, or ICE. By assigning each of these a numeric value, the team is able to rank the ideas based on a total sc.
Use ICE (Impact, Confidence, Effort) to rank and prioritize
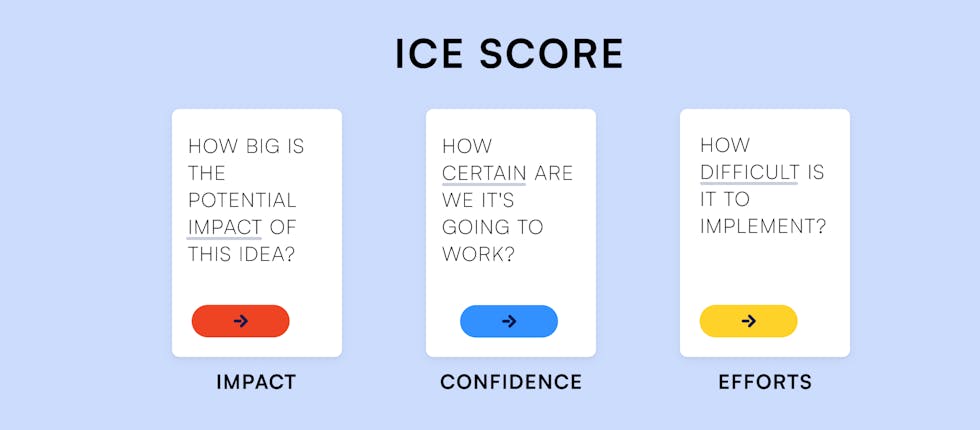
Impact is the predicted effect of a test on a metric. Predicting the impact of each solution will help you plan the order of experiments to be tested in this experiment loop. For example, Kim states, a predicted impact of 20% can be scored as 4-5 while anything below 10% might be a 1. While this is a difficult stage, both El Rabiey and Kim emphasize that through repetitive iterations of the entire process, your intuition will grow stronger and you will be able to predict impact with increasing accuracy. Kim has even developed a quantitative growth model that he uses to predict the impact of his experiments on various metrics.
Confidence is judging how likely a certain type of experiment will be effective based on past experiments or learning from other growth teams. Confidence is an impact modifier.
Effort considers the resources needed to run an experiment. More engineering hours or more dollars required would score 1-2, for example.
The team then ranks the solutions based on the total scores in order to prioritize which ones to run first. Common sense checks are important even while creating these prioritization models. If your engineering resources are limited, for example, try an experiment that requires minimal engineering resources. As you run many tests, you will modify and refine your models to suit your company.
Based on his experience, Kim also states that A/B testing, where you try two variations of a solution, yields much better data than multi-variant testing, where you’re experimenting with multiple variations. Many companies are using Formsort's split testing features to run these types of experiments. We'll cover this process later in the article. El Rabiey adds that while there might be a strong pull to do multi-variant testing early on in a company’s life, it’s better to group some solutions together in two packages and run A/B tests.
Stage 3: Implementation
Once you have the prioritized list of experiments it’s time to start implementing these experiments. There are two things we want to emphasize - first, you can't know the results without running the experiments. Second, there’s no such thing as a failed experiment. From every experiment you run you can learn and it’s helping you get closer to your goal.
The best growth teams have a 4 out of 10 success rate. That means successful growth teams test quickly and often to get better at it. The growth team at Mindbloom is running many experiments often. Below are two examples of experiments that Mindbloom ran, one successful and one informative for future experiments.
A successful Mindbloom experiment: Reduce friction to increase sales
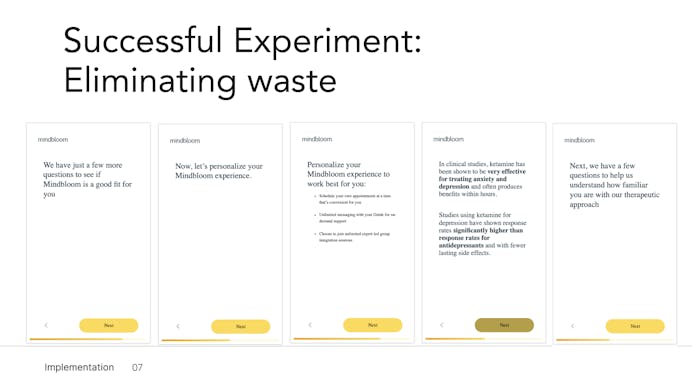
Mindbloom had a lot of informational steps to help build trust with the responders in their Formsort-powered flow. They decided to add more context and information to their sales landing page and saw an increase in conversion of 30%, so they wanted to test whether removing those now-redundant informational steps from the onboarding flow would help them convert leads even further. By calculating the number of drop-offs along the flow, they hypothesized that this test would increase conversion by 7-10%. This successful experiment led to a decrease in drop offs and increased conversion rates.
An informative experiment: Testimonials don’t always work
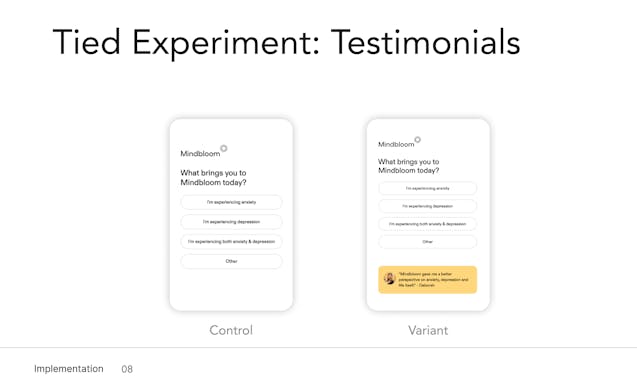
The Mindbloom team ran another experiment to target drop offs on the first page of their flow. They believed adding testimonials from real users of their product would be a worthwhile idea to test.
A quick A/B test showed that testimonials weren’t the missing secret ingredient as they did not show significant results. But they’d gotten one step closer to finding out what is.
Stage 4: Analysis
In both the examples cited above, the Mindbloom team analyzed the results of their experiments in order to make their next decisions. After each test you run, examining the incoming data will let you evaluate the success of the test. Does the data validate your prediction? Were there any surprises? What insights do the results give you about your customers, your product, and your funnel? Are there any immediate changes you can implement to continue growth or mitigate loss? Will it affect your confidence in similar experiments? Analyzing the data with your team will enable you to strategize the next steps.
A key takeaway for this stage is that once you reach your sample size and you have about an 80% indicator of success, you should move to the next test. Trying to perfect your statistical significance can even slow down your growth if you’re not moving on to the next test fast enough and testing continuously. You can learn more about test statistics and the Bayesian and Frequentist models here.
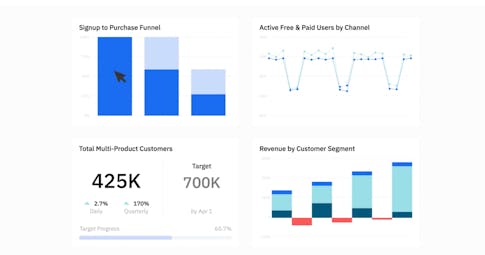
There are tools available to help you analyze test results. Kim highly recommends Amplitude. It’s an intuitive, easy-to-use platform that gives you insights from your experiment and lets you assess all parts of your conversion funnel. Even Google Sheets has tools that can support test analysis.
Stage 5: Systematization
Building systems to track and analyze tests over time is critical for the growth team as well as the rest of the company. Short term, a systematized database yields information that can help prioritize the next set of tests. Long term, they can inform macro-level strategies and educate new team members.
How do you systematize the process?
You can start by cataloging every experiment in a Google Sheets file, making sure to include the results and observations. This testing document reference can fuel ideation and future testing as well as educate new team members and the growing team. You can fill out this form to get access to the experiments template.

Speed is the name of the game
Test fast. Test a lot. However, testing frequently is only useful if you can learn from it. If you want to leverage your valuable data at the team and company level in order to grow rapidly, make sure to systematize your learning. This allows you to analyze what’s worked in the past that can be tried again or what didn’t work in one area but might in another. The more data you collect, the more informed your decisions are as your company grows. Move through the experimentation cycle quickly but efficiently by capturing your data and analysis in a testing document reference sheet.
Use Formsort to build and test your flows
As stated above, one of the best ways to experiment new ideas is with split testing. In this framework, you can create a test variant of your flow with the ideas you want to test. The test variant and a control variant with the existing flow are deployed randomly to site users, allowing you to see which performs better. Formsort’s integrations with analytics tools make it easy for your team to examine your results thoroughly at all levels.
Setting up your test in Formsort
- Create a new variant of an existing flow by duplicating an existing variant.
- It can be helpful to name the variant something that is easy to understand internally, like "test-email-capture," or keeping a record internally of what you changed to the test variant.
- Make changes on your test variant and test in staging.
- Once you're ready to start, you can deploy the test variant and add weights to the test and control variants in the flow. See randomly serving a test variant
- If you have custom domains set up, ensure that your domains are pointing to the general flow, with no variant set. This will ensure that the weight is respected.
- We'd also recommend using step IDs on all of your variants. This way, if the order of your steps changes in your testing, you'll still be able to compare apples-to-apples.
Analyzing results:
- Formsort integrates directly with Google Analytics, Google Tag Manager, and Amplitude for direct analysis.
- You can also use a CDP like Rudderstack or Segment to federate your data to the tool of your choosing.
- While there is more reporting functionality in a purpose-built analytics tool, Formsort also provides some basic analytics within the Formsort Studio. See variant performance at the flow level, and step analytics at the variant level.
Ready to build, experiment, and grow with Formsort?
Incorporate Formsort A/B testing in your experimentation process and build strong forms that convert. Explore our form builder here.